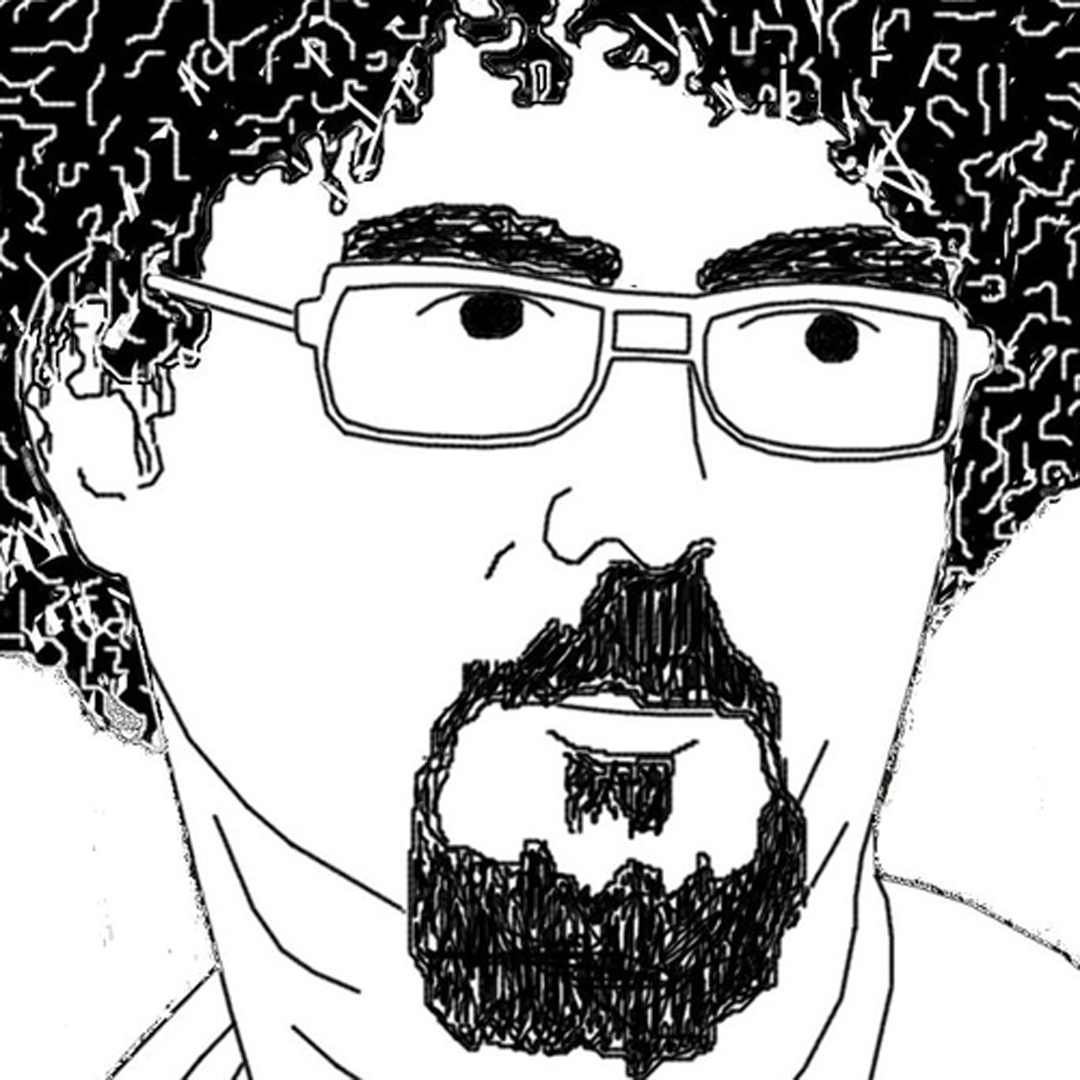
“Tinkering: How To Publish Your Household’s C02 Footprint for Geeky Fun and Societal Benefit” by Javier Candeira
Title:
- Tinkering: How To Publish Your Household’s C02 Footprint for Geeky Fun and Societal Benefit
Artist(s) and People Involved:
- Javier Candeira
-
- Monash University, AU
Exhibiting Artist(s):
Symposium:
Venue(s):
Artist Statement:
In the times of the printing press we gave rise to mass literacy, but only a few people could print, thanks to printer’s privilege accorded by the King. Then we had the encyclopedia giving access to knowledge to the many,but only a few could participate in contributing to the encyclopedia. In our modern times, we have the invention of the internet and browser, and now you have the tools to either personally publish via a blog, or publish your own media, and contribute to the development of global knowledge via Wikipedia.
But what’s really interesting about this data is when its seen as a cohort, not when its seen on its own by the user themselves. People want to be able to compare their data to data from people (or families) that are similar to their own – such as having the same size and age of family members, same size of house, and so on. Utilities don’t have level of personal data, only individuals can provide it.
The solution developed here is to give people a widget they can install on their PC, using the same username and password as they have to access their utility bills online. The widget displays emissions relative to a similar cohort, presented as an average, and based on what the community of widget users inputs. And then the widget is in a position to make suggestions of how you can do better, based on what people in your situation can and have done. The widget downloads the data and uploads it for you, and provides the data that is then available for the larger scale visualisations.
This gives rise to the second dilemma: we might be emulating the old model of the King’s privilege where only a few have access to the data and visualise it for everyone else (a broadcast model). The solution is to make everyone a data publisher. So cities, banks and utilities have the data, but as citizens we take data responsibility and publish it ourselves. Xively together with a device called the current cost monitor allows people to broadcast their realtime energy usage to the world. From this you get your own personal cloud of data. With many people doing the same there are societal patterns you can plot and education tools you can develop.
But the model has a few flaws. First, it’s costly (to produce and purchase these devices) and it’s wasteful. The current cost meter is a device that gathers data that we already
have – the utilities already have our personal energy data. Privacy concerns are what prevents our access to it in any other form than a quarterly bill.
Category:
All Works by the Artist(s) in This Archive:
- Javier Candeira
- More Art Events from Javier Candeira in this archive:

Tinkering: How To Publish Your Hous...
[ ISEA2013]


