“Building Run” by Keith Deverell
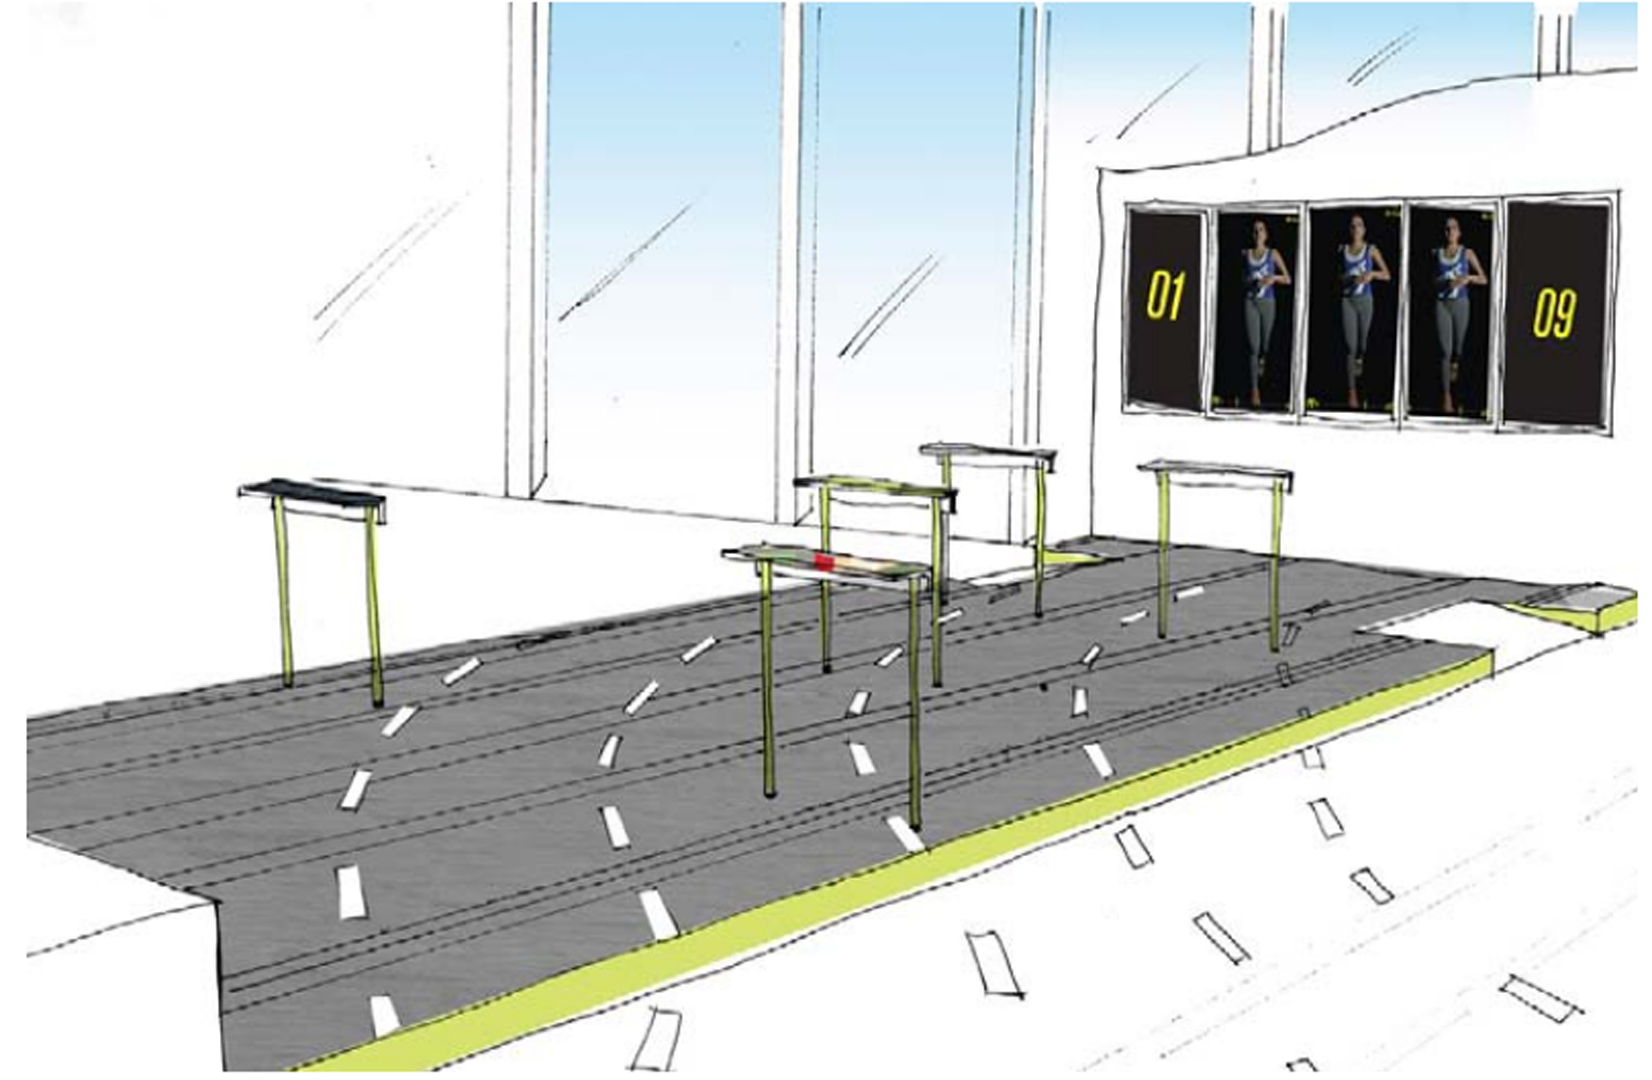
Image from City Data Slam report pdf
Title:
- Building Run
Artist(s) and People Involved:
Exhibiting Artist(s):
Symposium:
- ISEA2013: 19th International Symposium on Electronic Art
-
More artworks from ISEA2013:


Venue(s):
Artist Statement:
A day in the life… 09:00:00
Arrive at the office. Race for a low number.
The building’s been running hours before you arrive at work
Data: Buildings alive data on city office buildings’ real-time energy consumption.
Dilemma: How do we engage office workers in a greater appreciation of the energy efficiency of their buildings and spur them on to contribute their own efforts at saving energy?
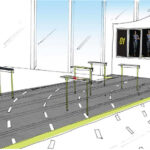
In developing his proposal for Building Run, Deverell was interested in employing a visual language or social language as a way of approaching environmental issues. He chose the language of sport because there is a strong sport culture in Sydney, as well as a corporate culture of sport and fitness. This was particularly relevant as Building Run uses corporate buildings’ energy consumption data and is placed within a corporate foyer. The key concept is about matching the real-time building energy consumption and mapping it as a race throughout the day. Building Run also explores the notion of humanising the buildings, and thinking about the human occupancy of buildings and how that affects the energy efficiency performance.
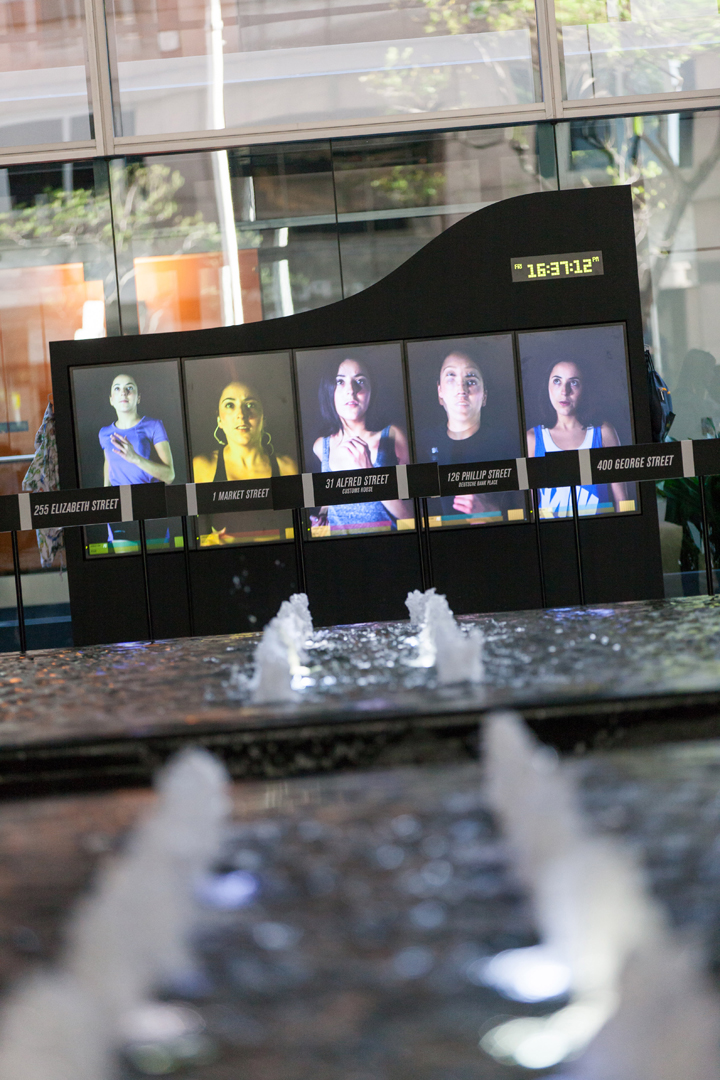
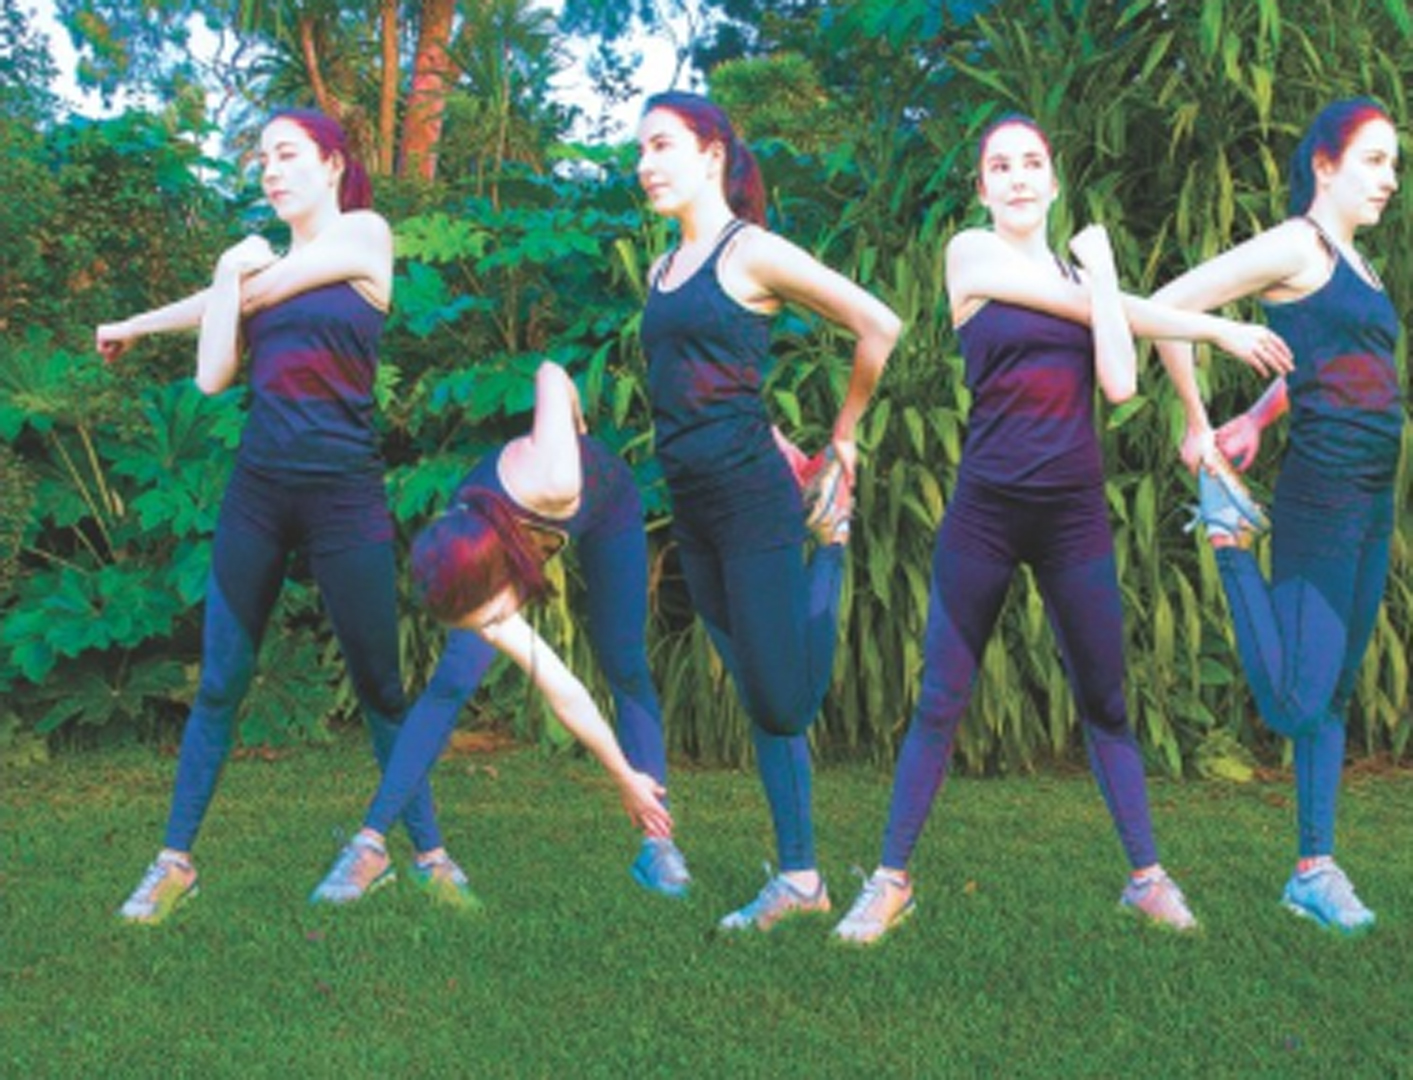
So, it’s 9am in the morning, the racers are stretching and warming up, it’s a kind of non-event. And then the race builds up to lunch time where people are flowing in and out of the buildings, and the runners are in full flow. At this point we see where all the buildings are positioned in the race. Throughout the day we see the different levels of exertion of the runners on the screens mapped to the energy consumption of the buildings – going from power walking, to running to exhaustion.
The data allows us to predict the performance of each building relative to previous performance, so in the end each building is racing against itself. Using this idea of the line in the world record, each runner is trying to beat their personal best. The fact that the sports world loves statistics is very fitting to this project.
Now, it’s the end of the day, and for those runners that don’t achieve their personal best, they are a bit despondent. But it’s ok because they get another chance. This relates well to the cyclical nature of building and corporate performance. Or, alternatively, they might have achieved a new personal best and so they wave to the crowd, receive flowers and are pretty happy. All these emotions are played out on the big screen, bringing the local office worker audience into a unique conversation about their contribution towards making their building greener.
Throughout the day we see the different levels of exertion of the runners on the screens mapped to the energy consumption of the buildings – going from power walking, to running to exhaustion.
Bio:
Keith Deverell is a Melbourne based video artist who also has a professional background in installation design and data visualisation. Keith’s video installations have been installed in both the Melbourne Laneways Commission, 2009, and the Melbourne International Arts Festival, 2010. Keith’s work has been acquired by the Singapore Art Museum (SAM) and exhibited in the Centre Pompidou. As a designer and programmer Keith was employed as a Associate Researcher at the Australian Centre for Interaction Design (ACID). Outside of his video work, Keith designs installations for exhibitions, such as for the NGV in Melbourne and Venice Biennial of Architecture.
Website:
Additional Images:

Image(s) from City Data Slam report pdf